Network of Materials & Reporting

MY ROLE AS SR. DESIGNER
Information Architecture
Process Mapping
Wireframing
Prototyping
UI Design
IX Heuristic Evaluation
PROBLEM TO SOLVE
In supply chain management, there's no visibility into on-hand material locations across the organization. The need is to reduce unnecessary ordering for faster, more cost efficient material transfers and to cut down excess inventory.
TARGETS & GOALS
-
Enable customers to understand the on hand and excess amount of inventory
-
Provide knowledge of exact material location across facilities for delivery requests
-
Give customers insight on total quantity and cost of excess materials
STEP ONE:
Information Architecture
The Information Architecture (IA) mapping helps plan each piece of data that needs to be on the individual reporting pages, both on the aggregate organizational view and also the plant specific views.

STEP TWO:
Wireframes
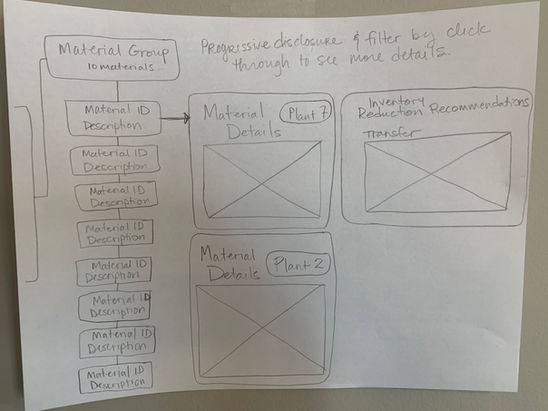
The wireframes cover each type of reporting Verusen provides within the platform.
They show some simple data visualizations and contain a progressive disclosure strategy in order to show more detail for specific materials and plant locations.

STEP THREE:
Visual UI Design & Interaction

PLANNING FOR NETWORK
Process Mapping
I created versions of process flow maps to diagram out interaction and step-by-step screens from clicks within the UI for the network of materials within an organization.
Showing organizational hierarchy and structure helped play a role in determining how all the data and information interacts with one another

PLANNING INTERACTION INTEGRATION
IX/UX Heuristic Evaluation
I conducted an IX / UX heuristic evaluation on each page of Verusen's application where Service Level data could be included and how access points into Service Level reporting can be added into the UI.
I detailed out what functionality and interaction is currently in the application, then detailed out the enhancements to the interaction to include service level.


